May, 2014
This information design project entitled “Back to the Future” explores the nature of predictions and their predictors. Spanning the start of the 19th century to present day, this piece analyzes the timelines of 20 predictions from their conception to their outcome along with the lifespan of their predictors. Through the use of symbols, color and line, rapid visual comparisons can be made between each prediction and predictor.
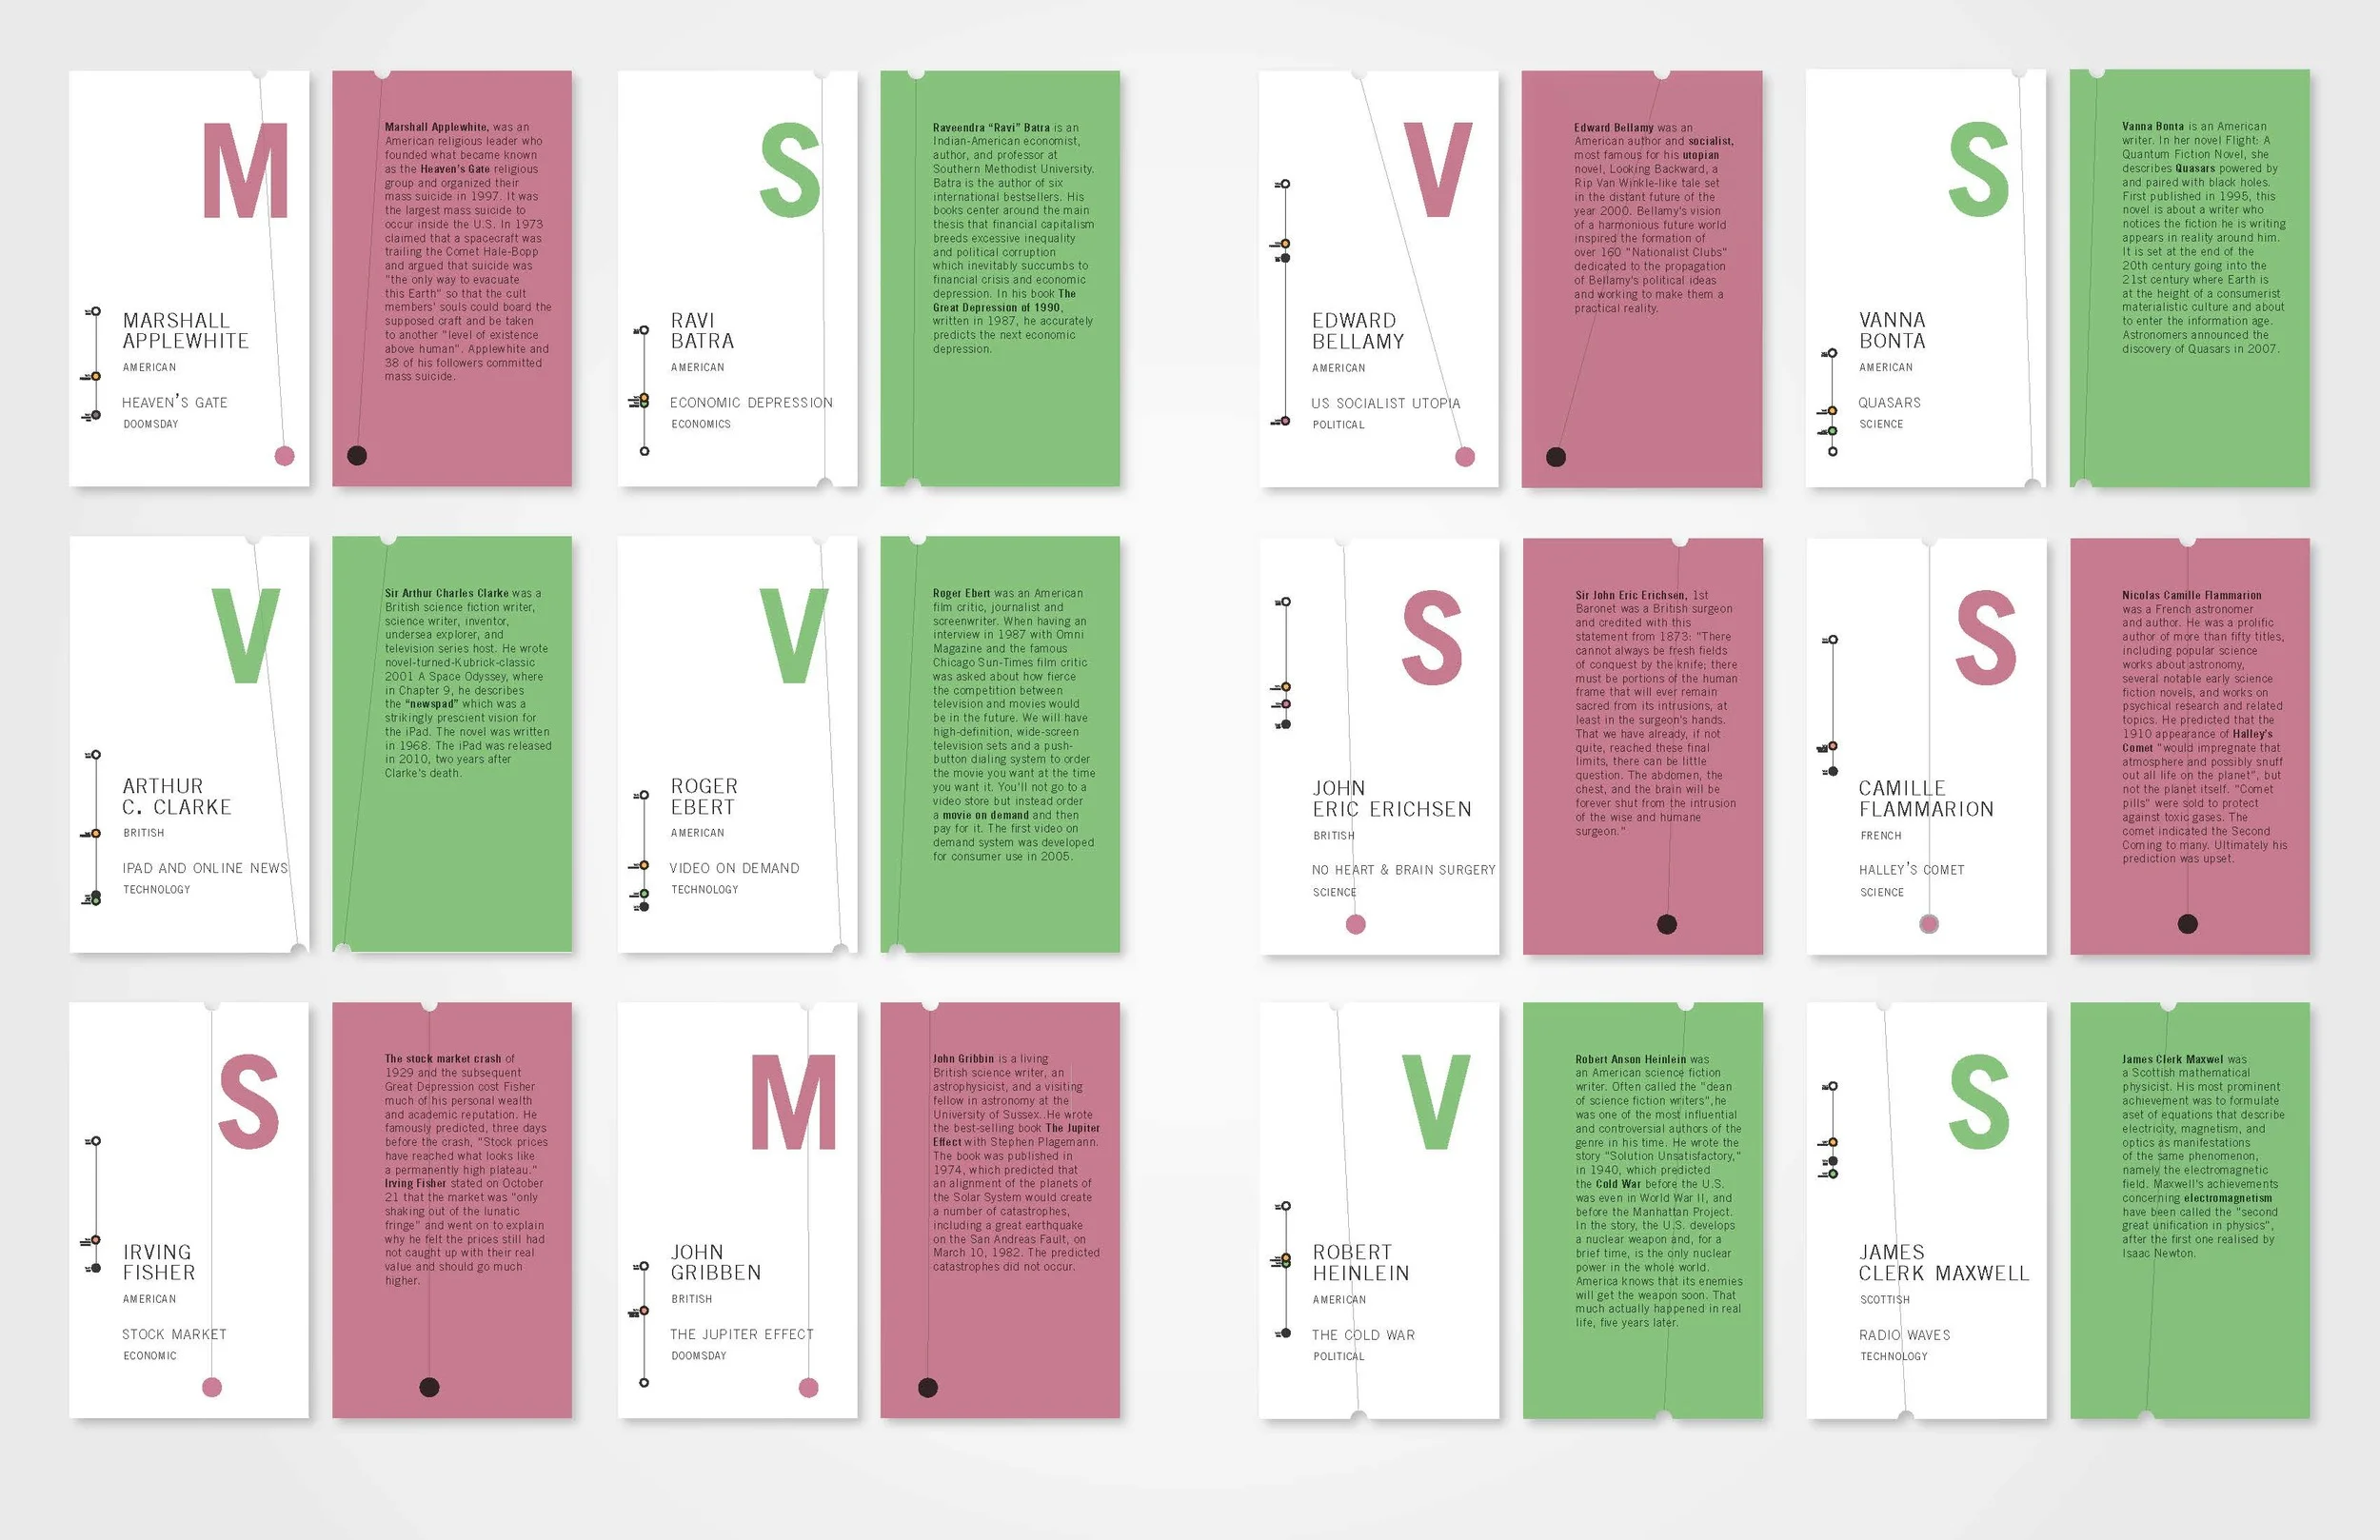
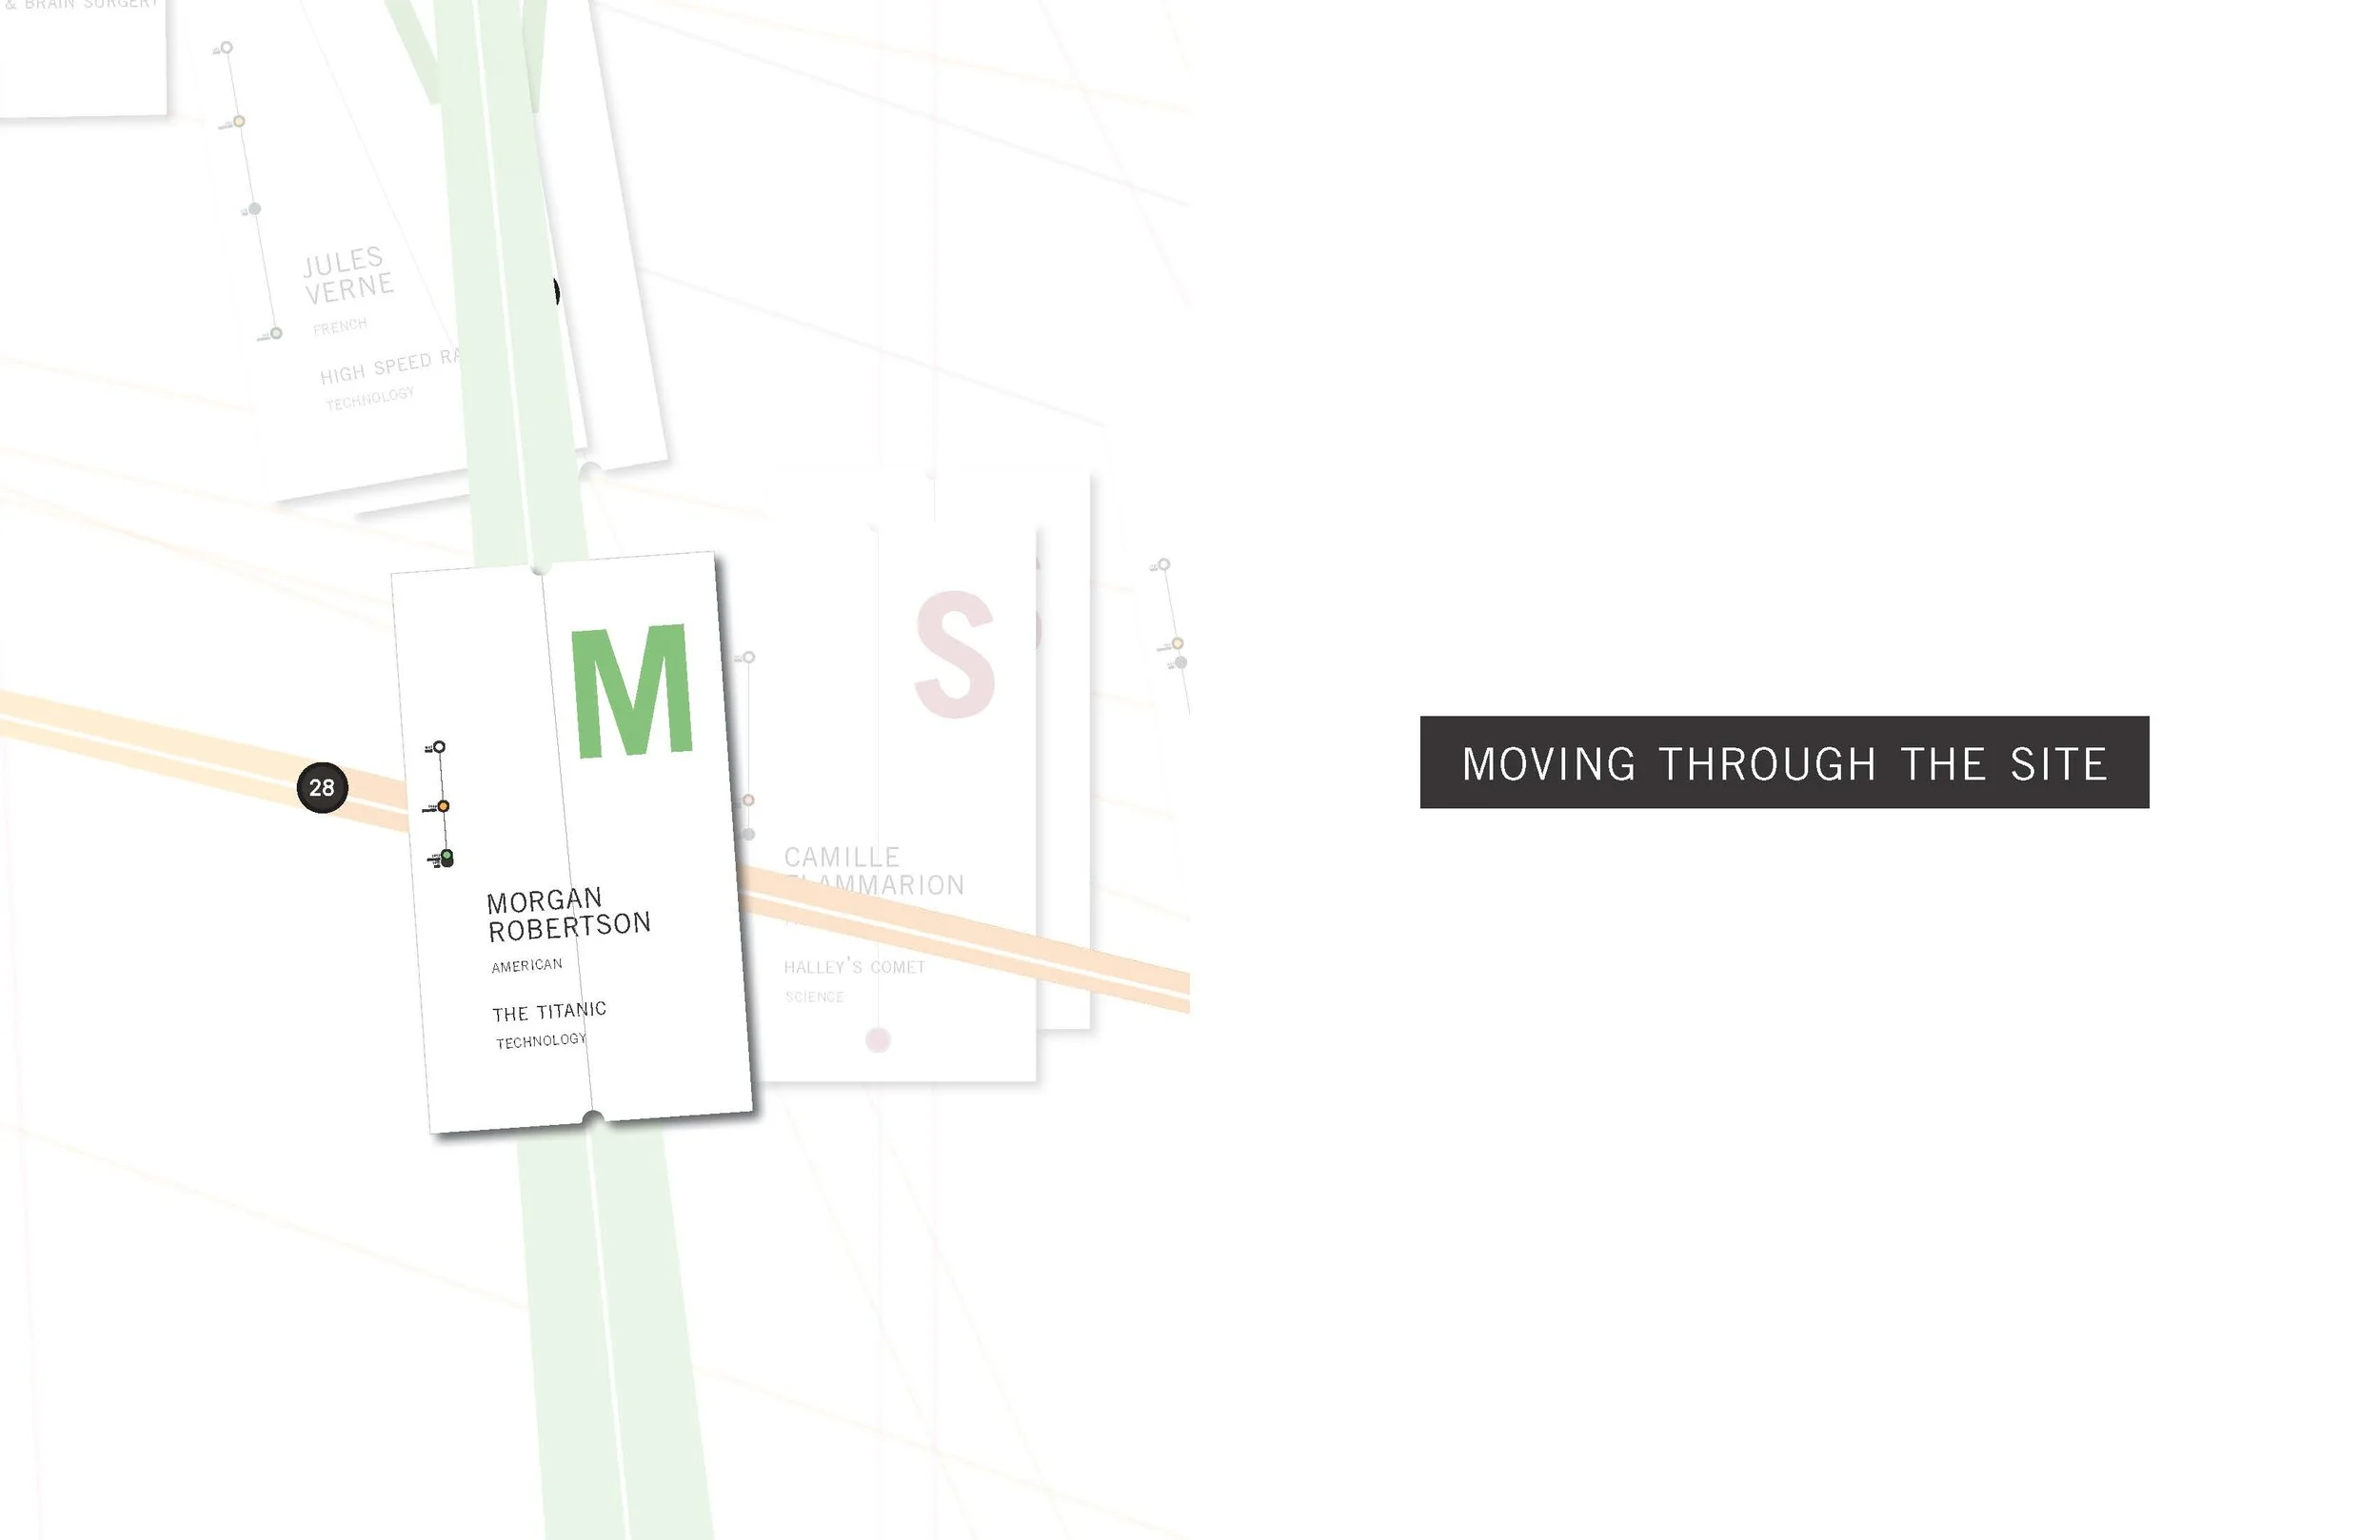
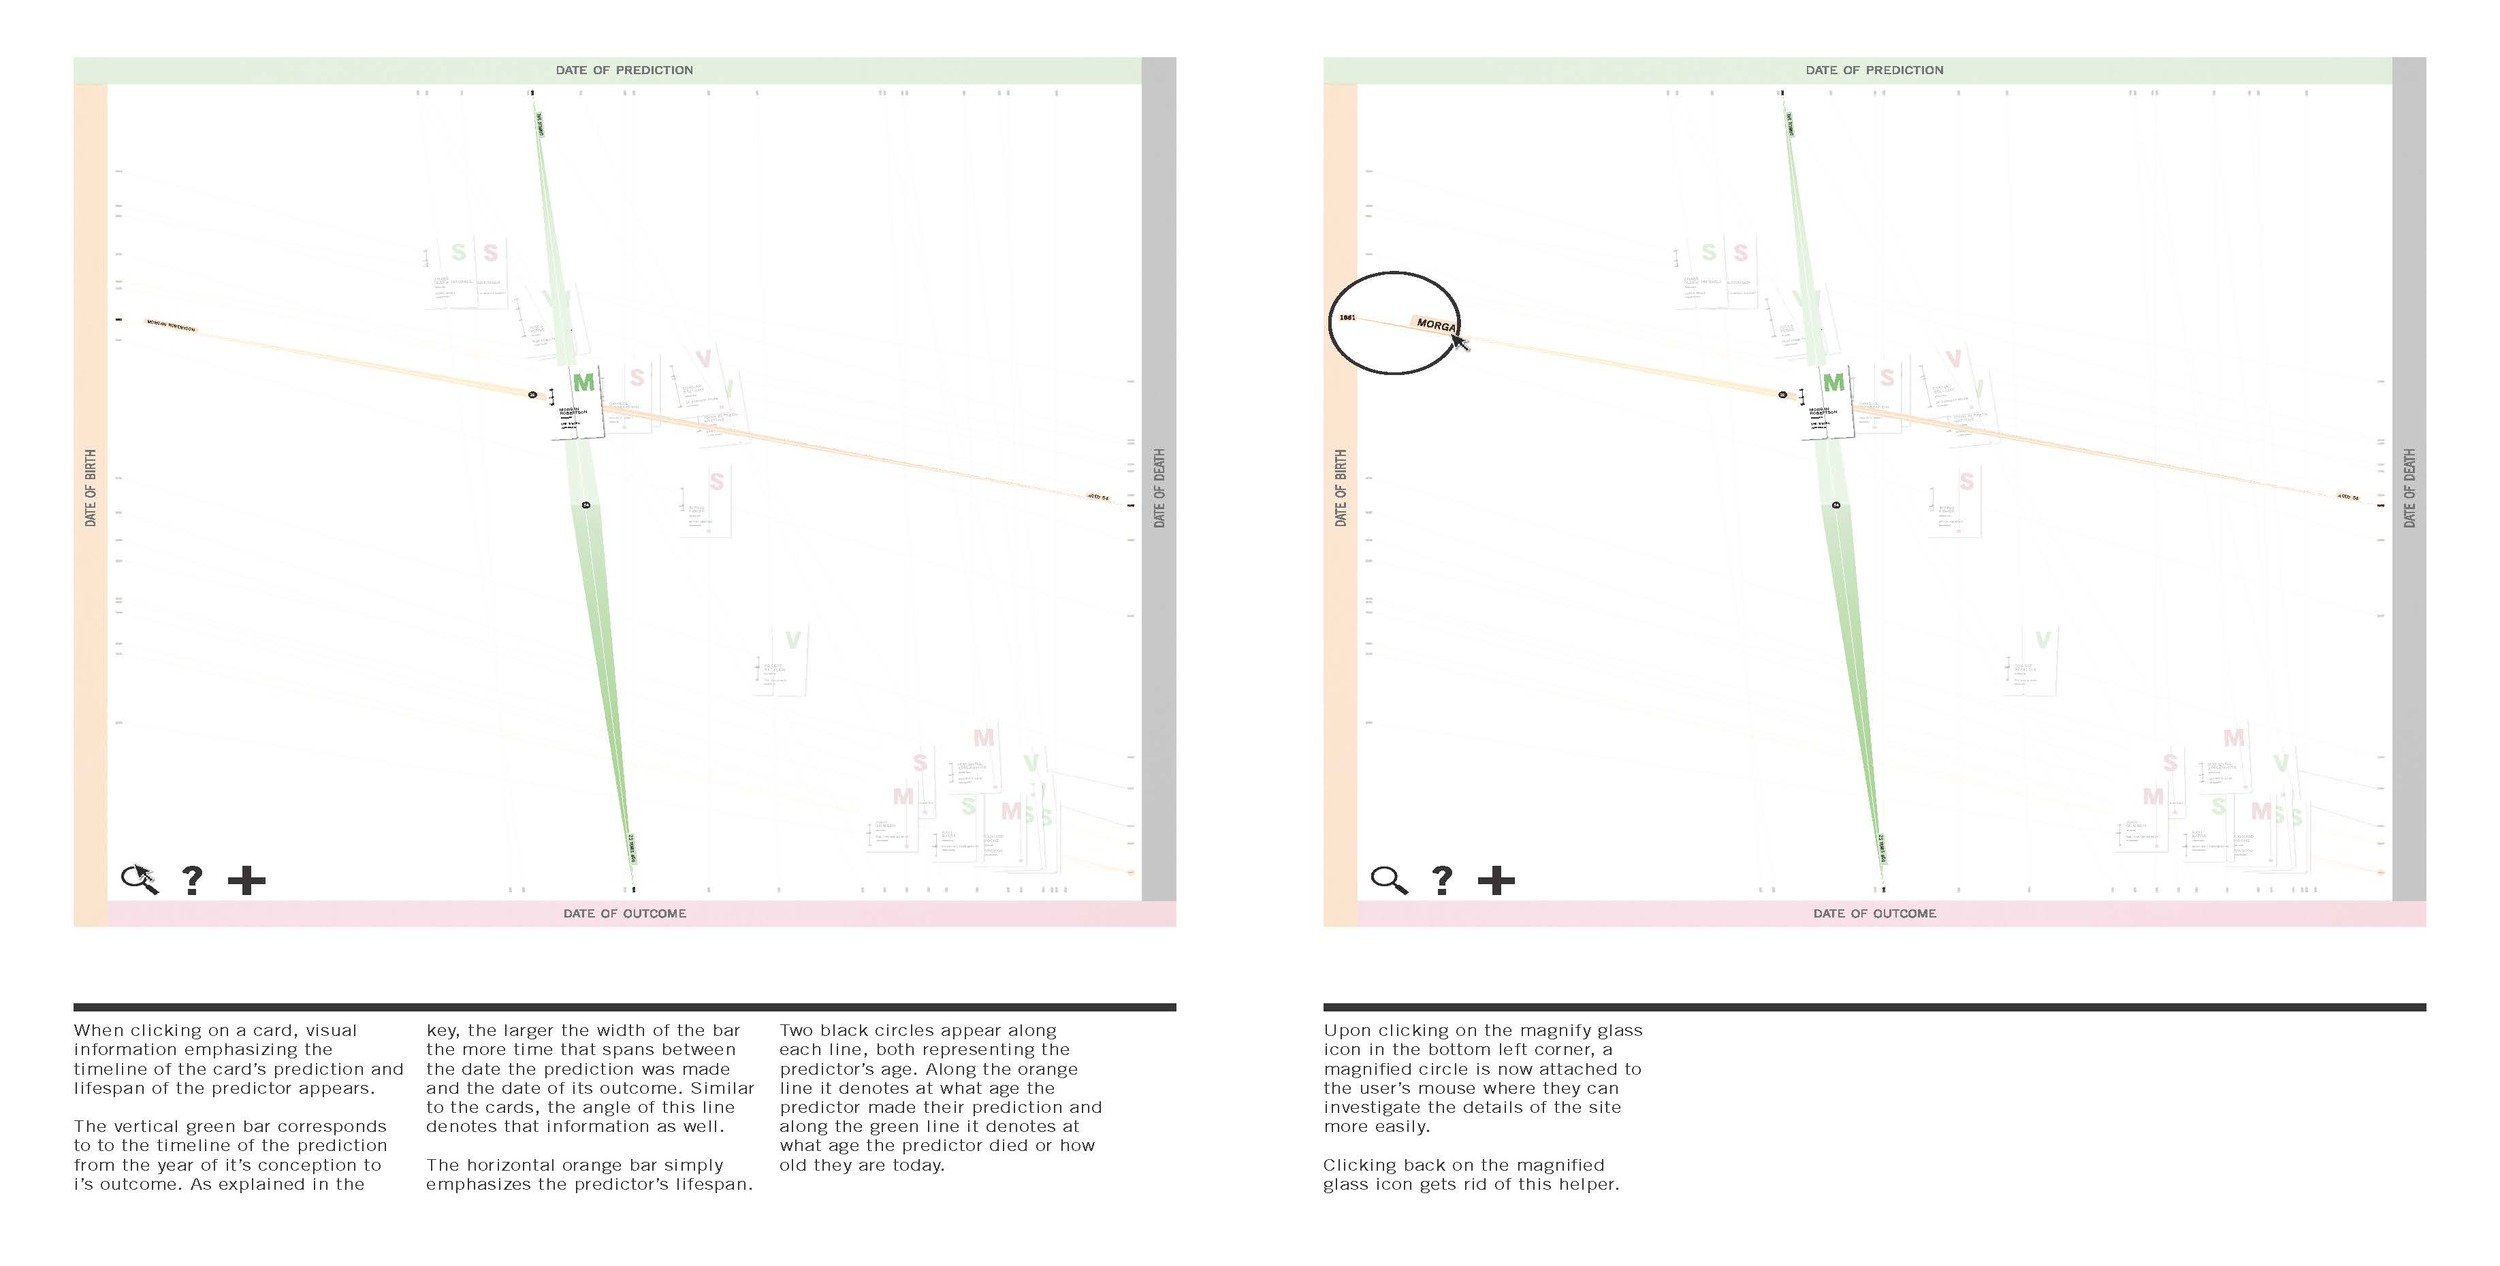
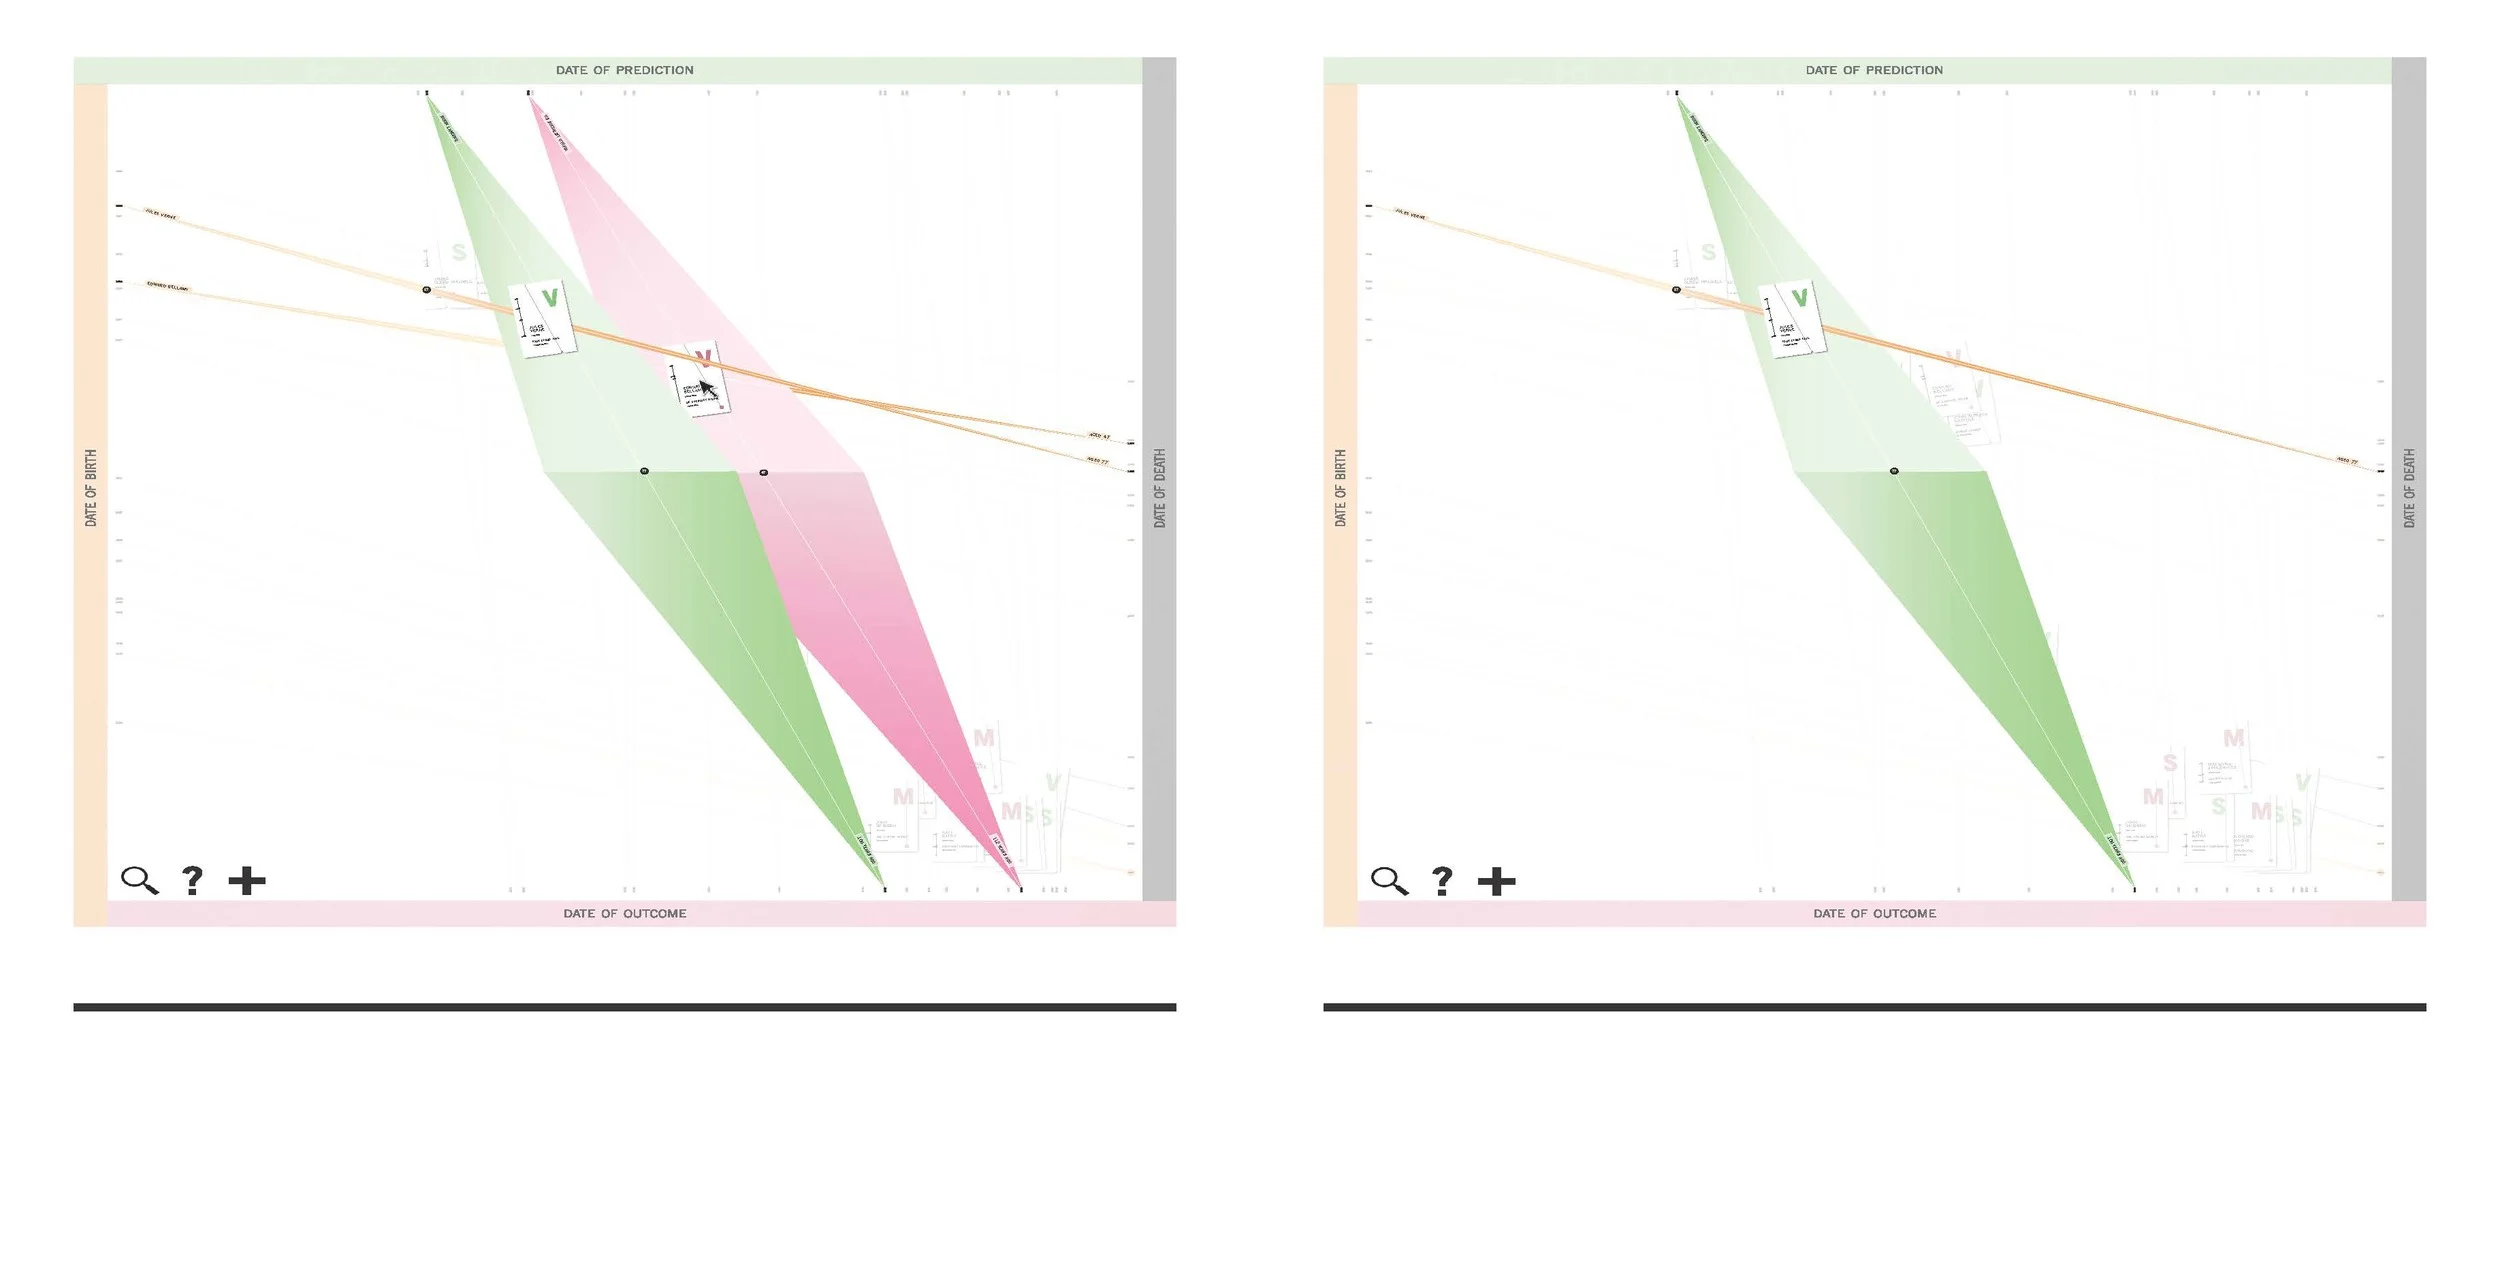
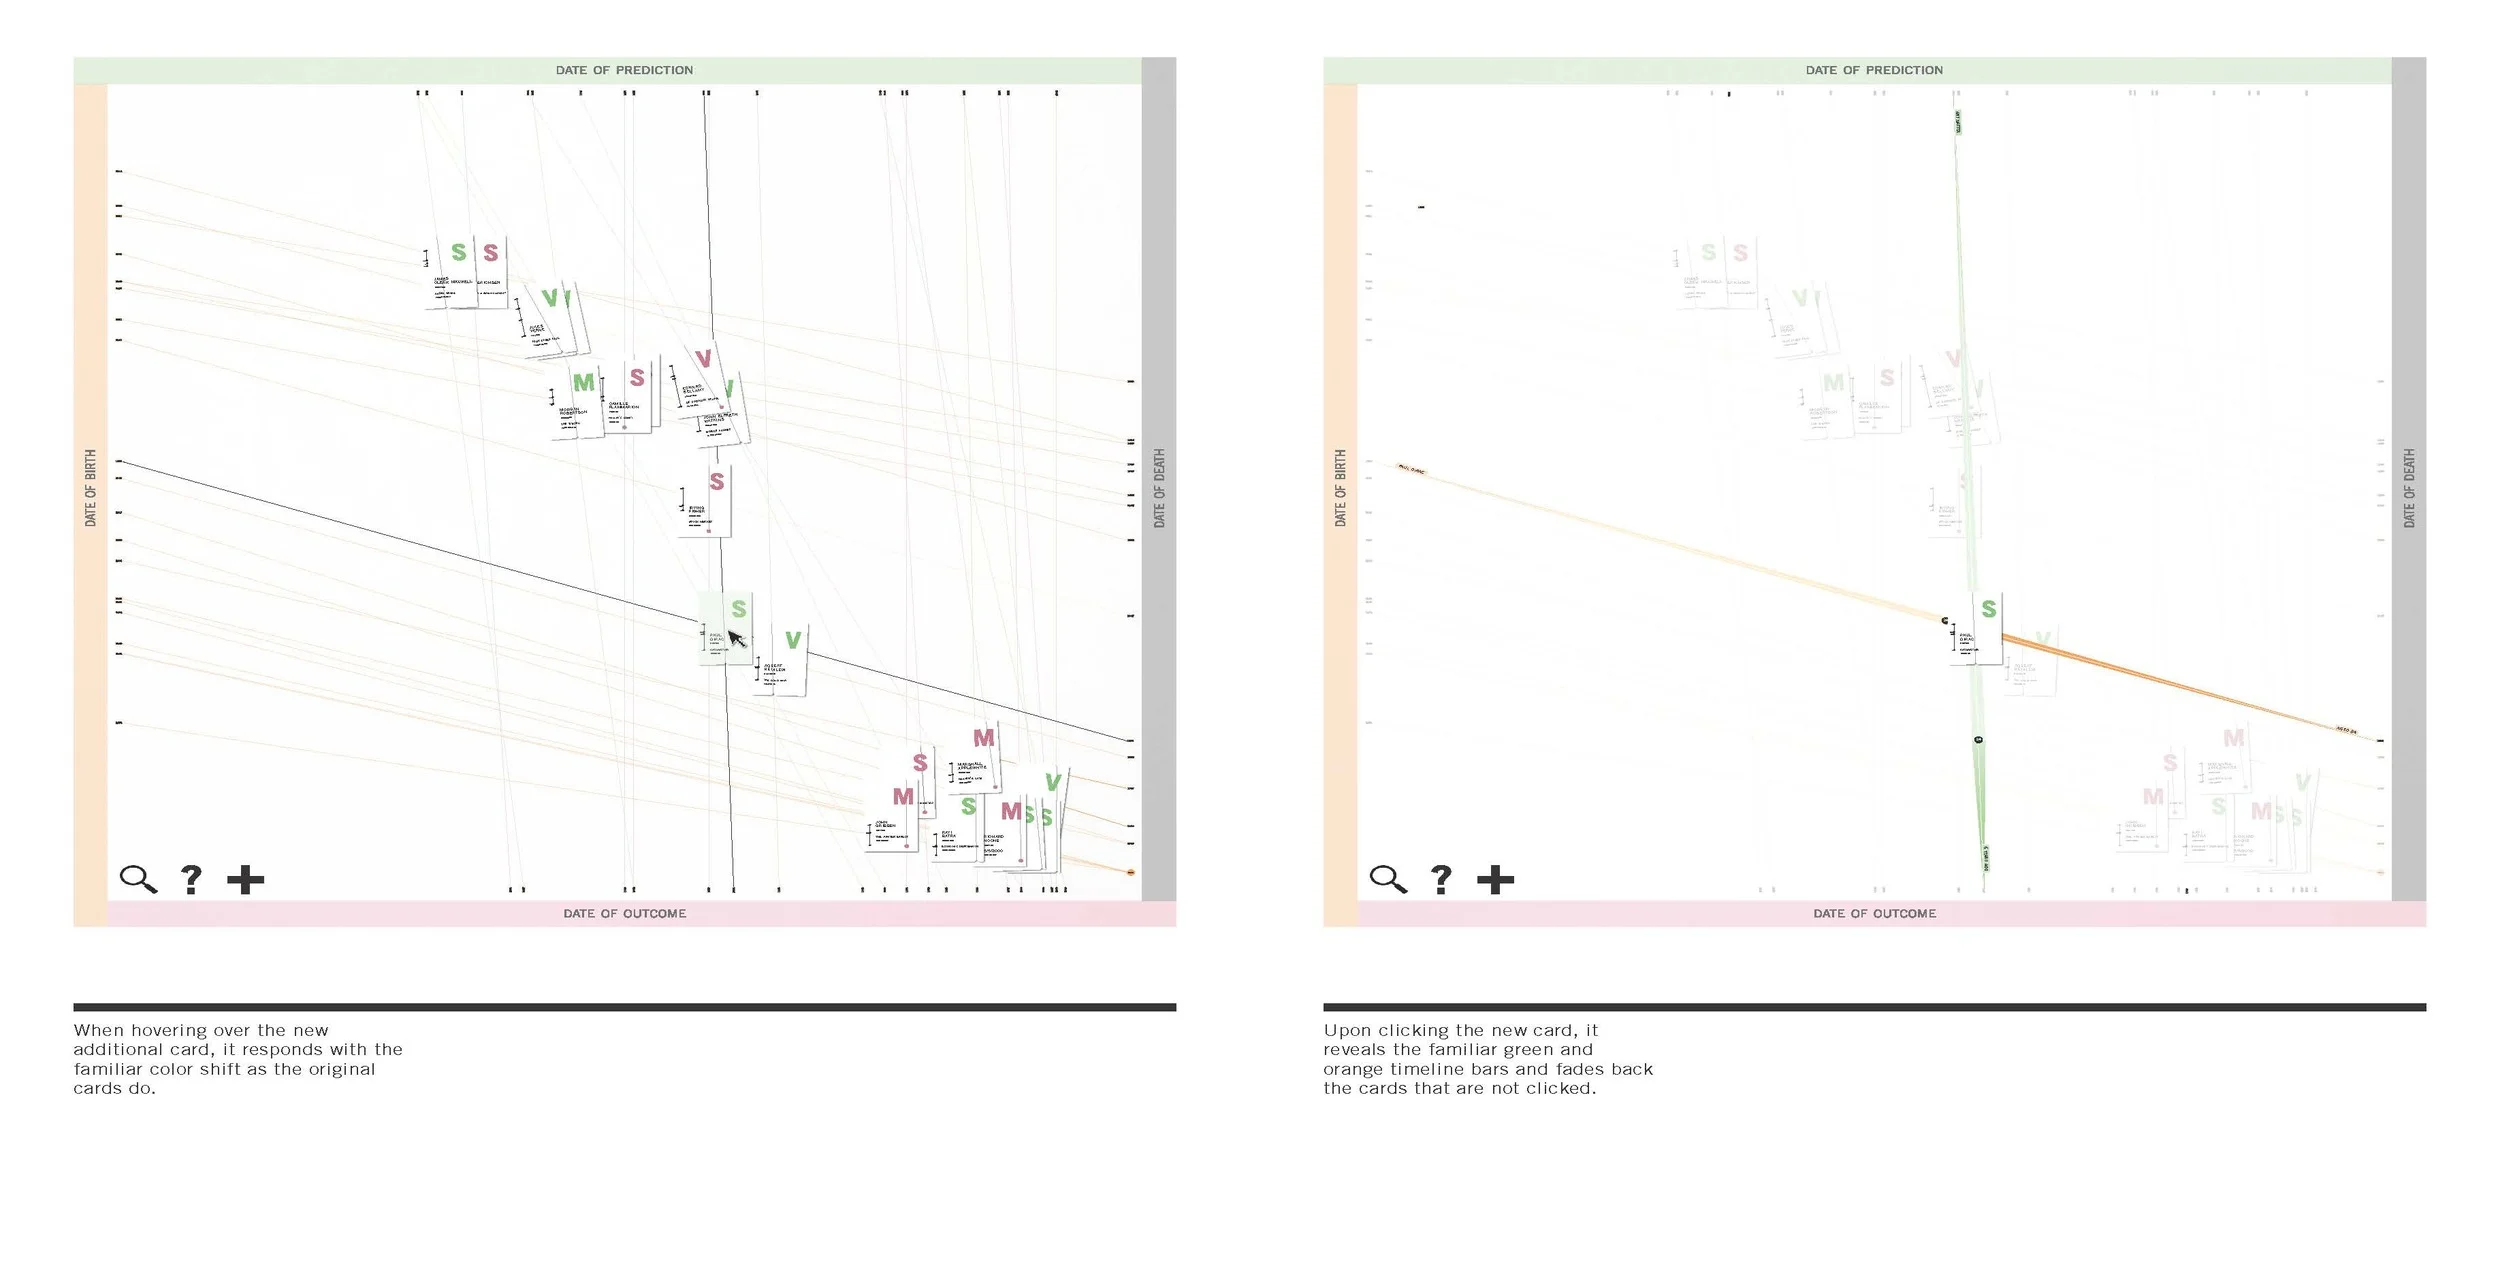
This project is executed in two mediums; a card set and an interactive tool. The card set is created for the user to form an intimate and tactile relationship with the information and hone in on the details of each prediction and predictor. More specific knowledge is earned from handling and observing the cards such as a predictor’s nationality, the categorization of prediction as well as written background context of each. The interactive tool explores this information in a broader setting while utlizing the cards themselves. As well, it incorporates the ability to add a prediction to the map and existing card set. Here, timelines are visualized in a larger scale and clicking through different interactive cards and their elements allows for a different form of rapid comparison to take place.
When were people making predictions? What types of predictions were being made? Who were the people making them? Are they creative visionaries, unfounded mystics, or statistical forecasters? Where are these people from? When in their life did they make these predictions? How far in the future were these predictions being made? Which types of predictions are accurate? Which are upset? Through visual analysis spanning multiple mediums, “Back to the Future” aims to answer these questions.


