May, 2015
I'm Alex. I'm 21 years old and if all goes according to plan — I'll be dead at 79.
That's science's plan for me — for all humans. Our current life expectancy is about 80 years, and that's not depressing or sad — it's actually pretty cool and exciting because I'm living 40% longer than my ancestors did when they were born in 1900. They were living 47 years max, and by the end of this century my future great grandchildren will be living to 100.
Time is changing. It's evolving and taking new shapes. We have a lot more of it too and that's what my project, entitled Well Spent, centers around — extra time and what we make of it.
I wasn't the only one thinking about what it means to live longer. News articles were asking about the implications of continued extra time in our lives. What does it mean for our health, society, our long-term plans? But the question that intrigued me most was: "What does that mean for our values and definitions of time?" It was a question I wanted to engage others with.
So I developed a series of surveys, asking people their opinions on time. They marked milestones on a line, circled shapes and words. They answered how they define their past and future and if they ever feel like they'll have enough time.
I took the topic and spirit of the survey and transferred it into something spatial. My classmates were asked similar questions and arranged their answers on a physical timeline.
It was exciting to start collecting all our goals, dreams and thoughts about time.
And when browsing through our responses we got these little snapshots of how we personally define and value time. As fun and insightful as this exercise was — it was lacking a logic and structure, a unique and meaningful visual form as well as a central foundational question.
So I developed a system to contain and express these different values of extra time — based on a grid of lines and circles.
There are 7 points on the line, plotted from left to right with 3 layers of expanding circles.
These points mark the answers to the question: "What would you do with an extra: hour, day, week, year, 5 years, 50 years, or 200 years?" The expanding circles mark the level of happiness that specific amount of extra time would bring to you:
- The first being the lowest amount of happiness
- The second being the medium amount of happiness
- The third being the highest amount of happiness
All that information is contained in this system and depending on how people value their extra time — its shape can change. There are hundreds of combinations to represent each personal and unique timeline and answers.
This systems brings us to the core visuals of the Well Spent project — an online digital collection of user responses to questions.
To build the collection, people answer the questions and assign a level of happiness it would bring to them — changing the shape of the timeline.
They can add media and relevant search tags.
In our example here — a 54 year-old man over a cup of coffee — is feeling reflective, and continues to answer these questions, becoming more in touch with what is important to him while seeing his values and timeline take shape.
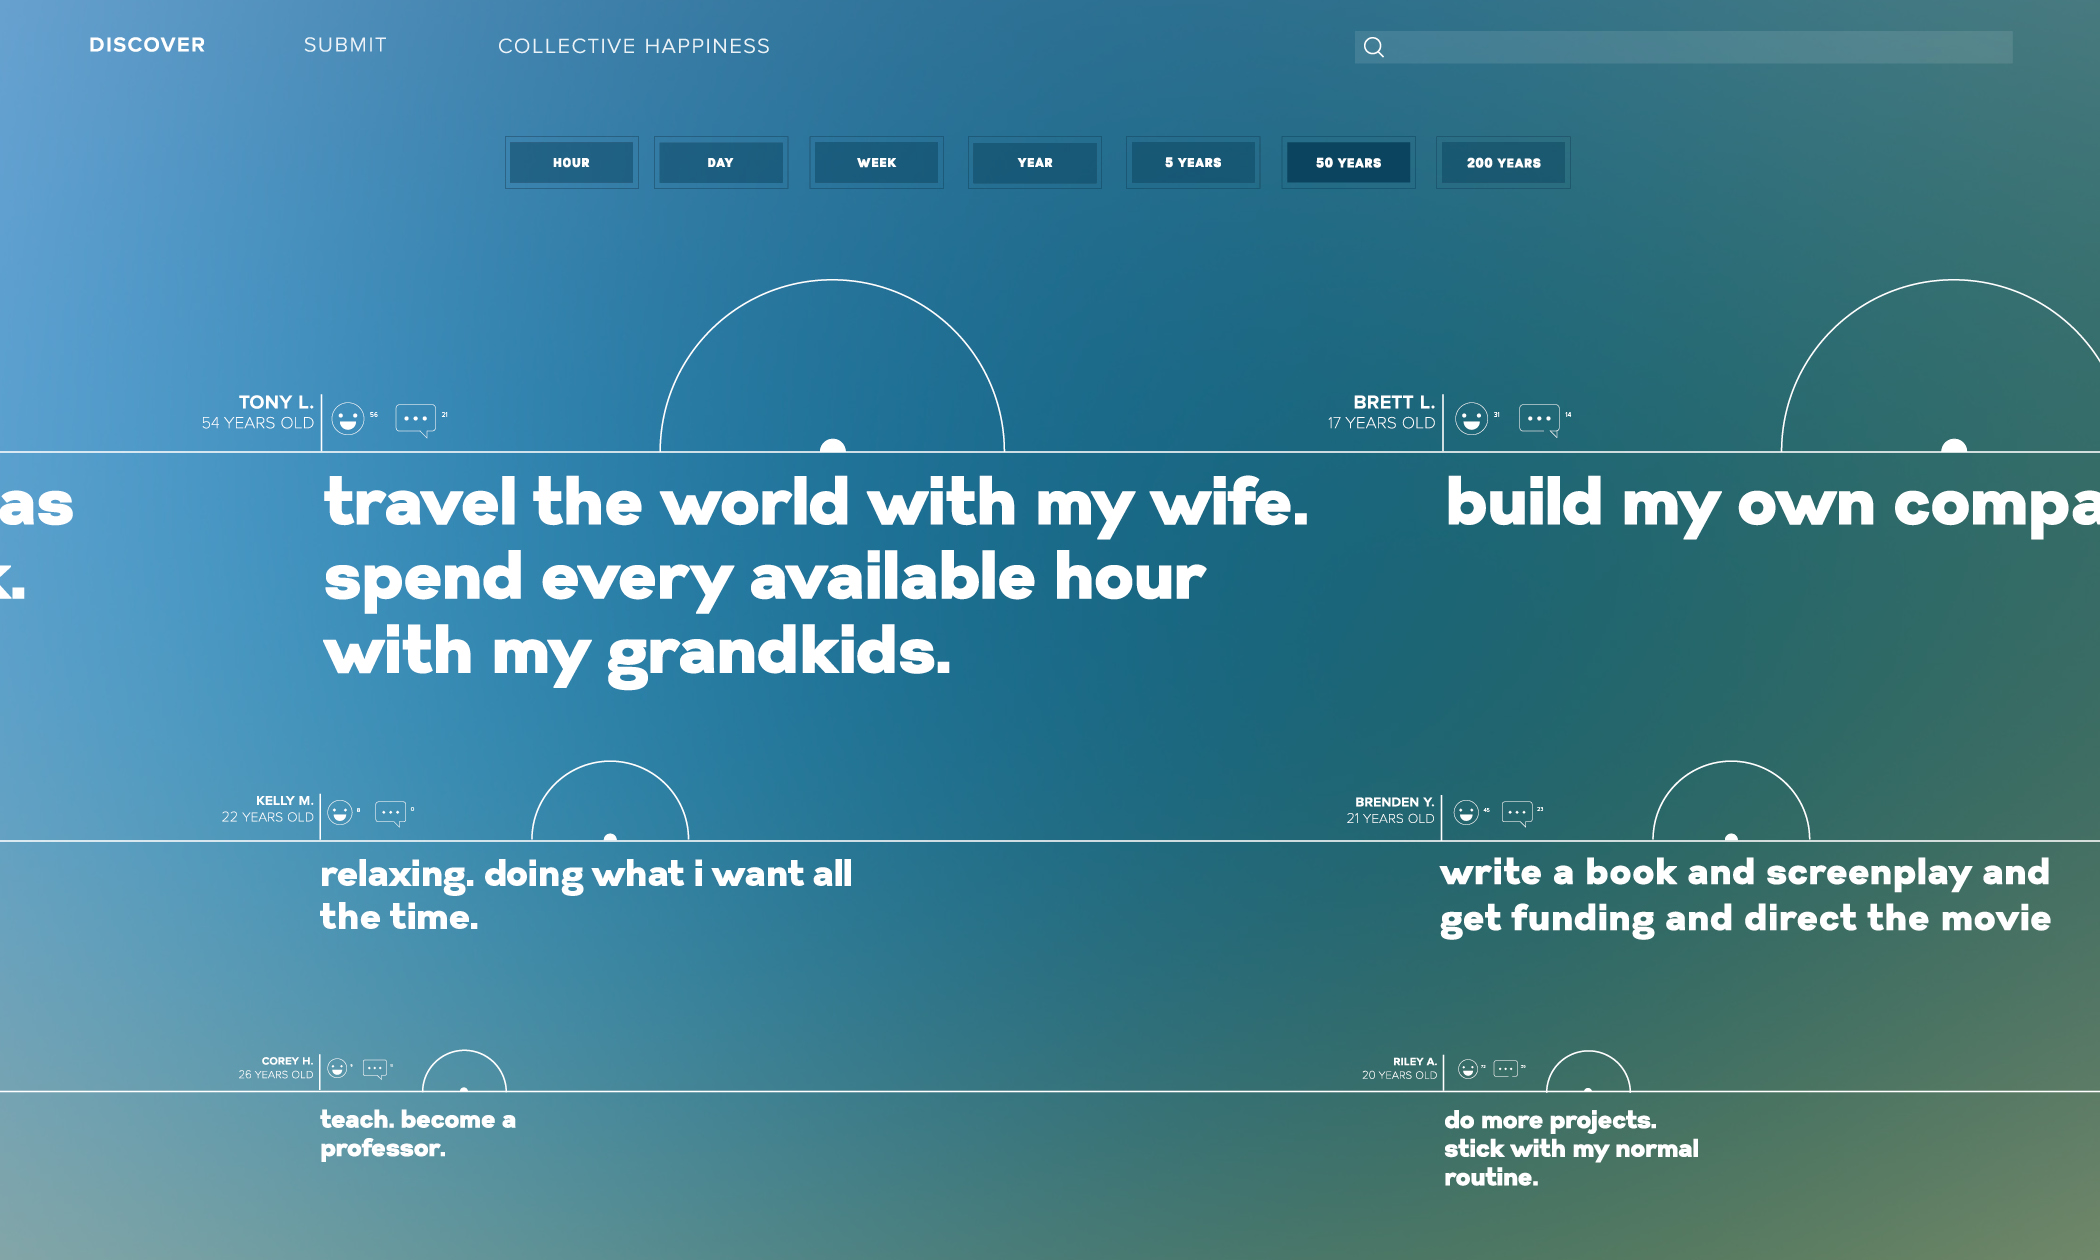
He is then able to see his timeline become a part of the collection. In this news-map view, our user Tony can compare how much he values his extra 50 years to 22 year-old Kelly who wants to relax, or 17 year-old Brett looking to build his own company.
If he is interested in whether people are thinking about a specific topic, fitness or biking for example, he can search for it and be presented with a view of all the people who are thinking about it as well as how much and when they value it.
He could return back and discover a specific amount of time and browse responses one by one. On this more intimate level, he can come across a response from a girl 30 years younger but is also thinking about traveling the world like he is.
Inspired by this community and curious about what it all means — he can view a breakdown of our collective happiness. We would all be happier with more time, that's the consensus. Based on user input data, what people would do with an extra 50 years would make them happiest. With 70% of people assigning the highest value of 3 to their 50 year mark. Two hundred years is at 59% followed by 5 years, 1 year, a week, a day and least valuable — an hour.
This is the shape of our collective timelines. We are most happy with things we feel require more than 5 years of extra time. How can we start actualizing these desires right now? As our lifespans increase, milestones may adjust and evolve. Now more than ever do we have the time to decide when to be happy.
Everyone spends their time differently but we all strive to spend it well. I hope your time learning about this project was well spent.


